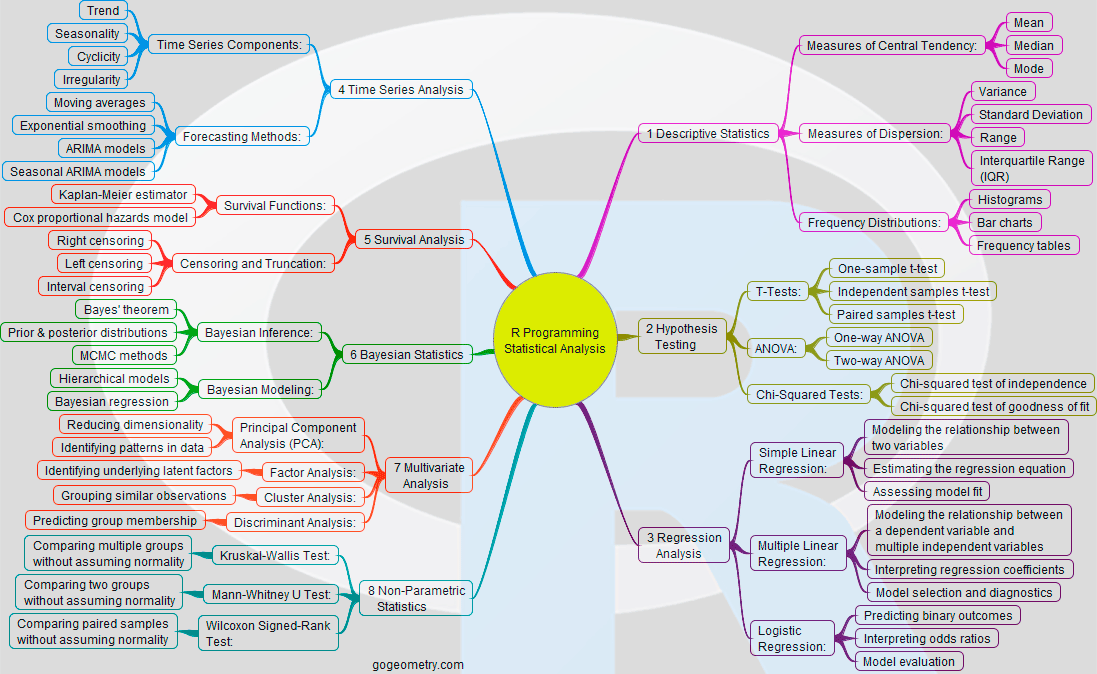
R Programming: A Mind Map of Statistical Analysis Topics
Data unfolds clear,
R weaves patterns in the clouds,
Numbers tell their tale.

R Programming: A Mind Map of Statistical Analysis Topics
Creating a mind map for R Programming: A Mind Map of Statistical Analysis Topics provides several focused benefits, particularly in relation to the tools and techniques available in R for statistical analysis:
1. Organizes R Tools and Techniques
R offers a wide range of tools for statistical analysis, from basic packages like base to advanced libraries like ggplot2, dplyr, and caret. A mind map visually organizes these tools, helping learners see which packages to use for tasks like data cleaning, visualization, or machine learning.
2. Clarifies Analytical Processes
R programming often involves a series of steps: data import, exploration, testing, and visualization. A mind map shows how these stages connect and which R functions or packages are used at each step (e.g., read.csv for importing data, t.test for hypothesis testing). This helps users plan and streamline their analyses.
3. Breaks Down Statistical Methods
Complex statistical methods in R, like regression, ANOVA, or time series analysis, can be overwhelming. A mind map breaks these down, showing which R functions (e.g., lm() for linear regression, aov() for ANOVA) correspond to each statistical method. This simplifies the learning process by connecting theory with the practical tools available in R.
4. Highlights Key R Libraries
A mind map highlights essential R libraries for different tasksóggplot2 for visualization, dplyr for data manipulation, caret for machine learning. This makes it easier for users to remember which libraries to load for specific tasks and how these tools complement each other.
5. Facilitates Efficient Tool Selection
When working on a project, users can refer to the mind map to quickly identify the appropriate tools. For example, if they need to conduct statistical tests, they might use t.test or chisq.test, depending on the type of data. This reduces the time spent searching for the right function and improves workflow efficiency.
In short, a mind map organizes the many tools and methods in R, helping users visualize the connections between statistical concepts and the practical tools available in the language, leading to more efficient and structured analysis.
Introduction to R Programming Mind Map
R Programming: Data Import / Export Mind Map
R Installation and Administration Mind Map
Effective Accelerationism and AI Integration Mind Map
Empowering Human Potential with ChatGPT and Bard's Mind Map
Artificial Intelligence Major Goals
Artificial Intelligence Approaches
Artificial Intelligence Technology
Artificial Intelligence Philosophy


